Visualize and Report Ansible with OpenTelemetry and Syslog
Ansible is a fantastic tool to manage fleets of machines, but it’s difficult to provide effective reporting when the fleet massively scales. Imagine hundreds of lines like this; try to find the one that failed (and why):
PLAY RECAP *********************************************************************
dev.lab.engyak.net         : ok=6    changed=0    unreachable=0    failed=0    skipped=0    rescued=0    ignored=0
…it’s not difficult to read, but it doesn’t decide what might deserve individual attention. It’s possible to create Jinja reports that will be more executive-friendly, but they’re focused on individual executions as well.
Ansible callback plugins provide us a framework to aggregate and analyze information about playbook execution without compromising idempotency.
Types of Callback Plugins
aggregate
aggregate callback plugins modify the summary at the end of a task’s output. They don’t appear to impact recap, and don’t have many useful examples.
stdout
stdout callback plugins modify the continual output presented as Ansible completes work:
TASK [Update Apt!] *************************************************************
ok: [dev.lab.engyak.net]
This is where the fun begins! Note that only one plugin for stdout can be selected for a given playbook.
Using stdout callbacks
The process for enabling callback plugins in ansible.cfg. Since this is executed from an environment (GitHub Actions), I prefer leveraging environment injection.
ANSIBLE_CALLBACK_RESULT_FORMATcontrols how data is printed out from individual tasks on the screen, this is up to preference. I preferyaml, and recommend playing with this setting to see what works best for you.ANSIBLE_PYTHON_INTERPRETERsilences any chatter about the discovered Python interpreter. Since this is a consistent environment without any tight coupling to specific releases, I don’t feel the need to pin one, and I don’t want to see the messages.DEFAULT_STDOUT_CALLBACKwill let you set thestdoutcallback plugin
In GitHub Actions, you can use the env key to manipulate outputs without having to change any code. I’m also integrating Netbox into this pipeline.
jobs:
  build:
    name: 'Manage Lab Configurations'
    runs-on: self-hosted
    env:
      ANSIBLE_PYTHON_INTERPRETER: 'auto_silent'
      ANSIBLE_STDOUT_CALLBACK: 'default'
      ANSIBLE_CALLBACK_RESULT_FORMAT: 'yaml'
      NETBOX_TOKEN: ${{ secrets.NETBOX_TOKEN }}
      NETBOX_API: ${{ vars.NETBOX_URL }}
    steps:
      - uses: actions/checkout@v4
      - name: Execute Ansible Management Playbook
        run: |
          python3 -m venv .
          source bin/activate
          python3 -m pip install --upgrade pip
          python3 -m pip install -r requirements.txt
          ansible-inventory -i local.netbox.netbox.nb_inventory.yml --graph
          ansible-playbook -i local.netbox.netbox.nb_inventory.yml lab-management.yml
For reference purposes, I’ve added all compatible fields here. The yaml results format is considerably more compact given the character limit per line.
dense seems to be a popular callback, and it uses colorization to generate play output, and tries to place things all on one line:
task 1.task 1: ns2.lab.engyak.nettask 1: ns2.lab.engyak.net ns.lab.engyak.nettask 2.task 2: ns2.lab.engyak.nettask 2: ns2.lab.engyak.net ns.lab.engyak.nettask 3.task 3: ns2.lab.engyak.nettask 3: ns2.lab.engyak.net ns.lab.engyak.nettask 4.task 4: ns.lab.engyak.nettask 4: ns.lab.engyak.net ns2.lab.engyak.nettask 5.task 5: ns2.lab.engyak.nettask 5: ns2.lab.engyak.net ns.lab.engyak.nettask 6.task 6: ns2.lab.engyak.nettask 6: ns2.lab.engyak.nettask 6: ns2.lab.engyak.nettask 6: ns2.lab.engyak.net ns.lab.engyak.nettask 6: ns2.lab.engyak.net ns.lab.engyak.nettask 6: ns2.lab.engyak.net ns.lab.engyak.nettask 7.task 7: ns.lab.engyak.nettask 7: ns.lab.engyak.net ns2.lab.engyak.nettask 7: ns.lab.engyak.net ns2.lab.engyak.nettask 7: ns.lab.engyak.net ns2.lab.engyak.nettask 7: ns.lab.engyak.net ns2.lab.engyak.nettask 7: ns.lab.engyak.net ns2.lab.engyak.nettask 8.task 8: ns2.lab.engyak.nettask 8: ns2.lab.engyak.net ns.lab.engyak.nettask 9.task 9: ns2.lab.engyak.nettask 9: ns2.lab.engyak.net ns.lab.engyak.nettask 10.task 10: ns2.lab.engyak.nettask 10: ns2.lab.engyak.net ns.lab.engyak.net
It’s definitely compact, but not super readable. oneline is probably the best non-default plugin of the bunch, but it’s much more verbose than the default one. It also displays a lot of system-specific information, so no snippet here.
notification
This is where things get really good for those of us with execution environments! notification callback plugins send data to external systems when a play finishes.
Directing results to OpenTelemetry
OpenTelemetry is a truly neat open standard for exchanging “trace information” between systems.
This is incredibly useful, but also difficult to explain in a way that’s clear without providing concrete examples. Essentially, OpenTelemetry-based traces allow debugging systems that do not all exist in the same software package, and it offers a timeline for each step. As it happens, Ansible’s callback plugin is well-architected and a good example of the value that a trace can have, even from an application perspective.
First, we’ll need to assemble an OpenTelemetry-compliant platform to stream Ansible results to. I’ve selected Jaeger for this purpose. It has an all-in-one quickstart function:
docker run --rm --name jaeger \
  -p 16686:16686 \
  -p 4317:4317 \
  -p 4318:4318 \
  -p 5778:5778 \
  -p 9411:9411 \
  cr.jaegertracing.io/jaegertracing/jaeger:2.12.0
Once it’s running, we need to instruct Ansible to forward data. This is achievable exclusively with environment variables:
  env:
    ANSIBLE_CALLBACKS_ENABLED: 'community.general.opentelemetry'
    ANSIBLE_OPENTELEMETRY_ENABLE_FROM_ENVIRONMENT: 'ANSIBLE_OPENTELEMETRY_ENABLED'
    ANSIBLE_OPENTELEMETRY_ENABLED: 'true'
    OTEL_EXPORTER_OTLP_ENDPOINT: 'http://jaeger.lab.engyak.net:4317'
    OTEL_EXPORTER_INSECURE: 'true'
    OTEL_SERVICE_NAME: 'ansible'
In addition to these variables, the module requires the following additions to requirements.txt:
opentelemetry-sdk
opentelemetry-exporter-otlp-proto-grpc
opentelemetry-exporter-otlp-proto-http
Once these changes get applied, with no other required changes to the Ansible code itself, all subsequent runs submit OTLP traces to Jaeger It looks like this:
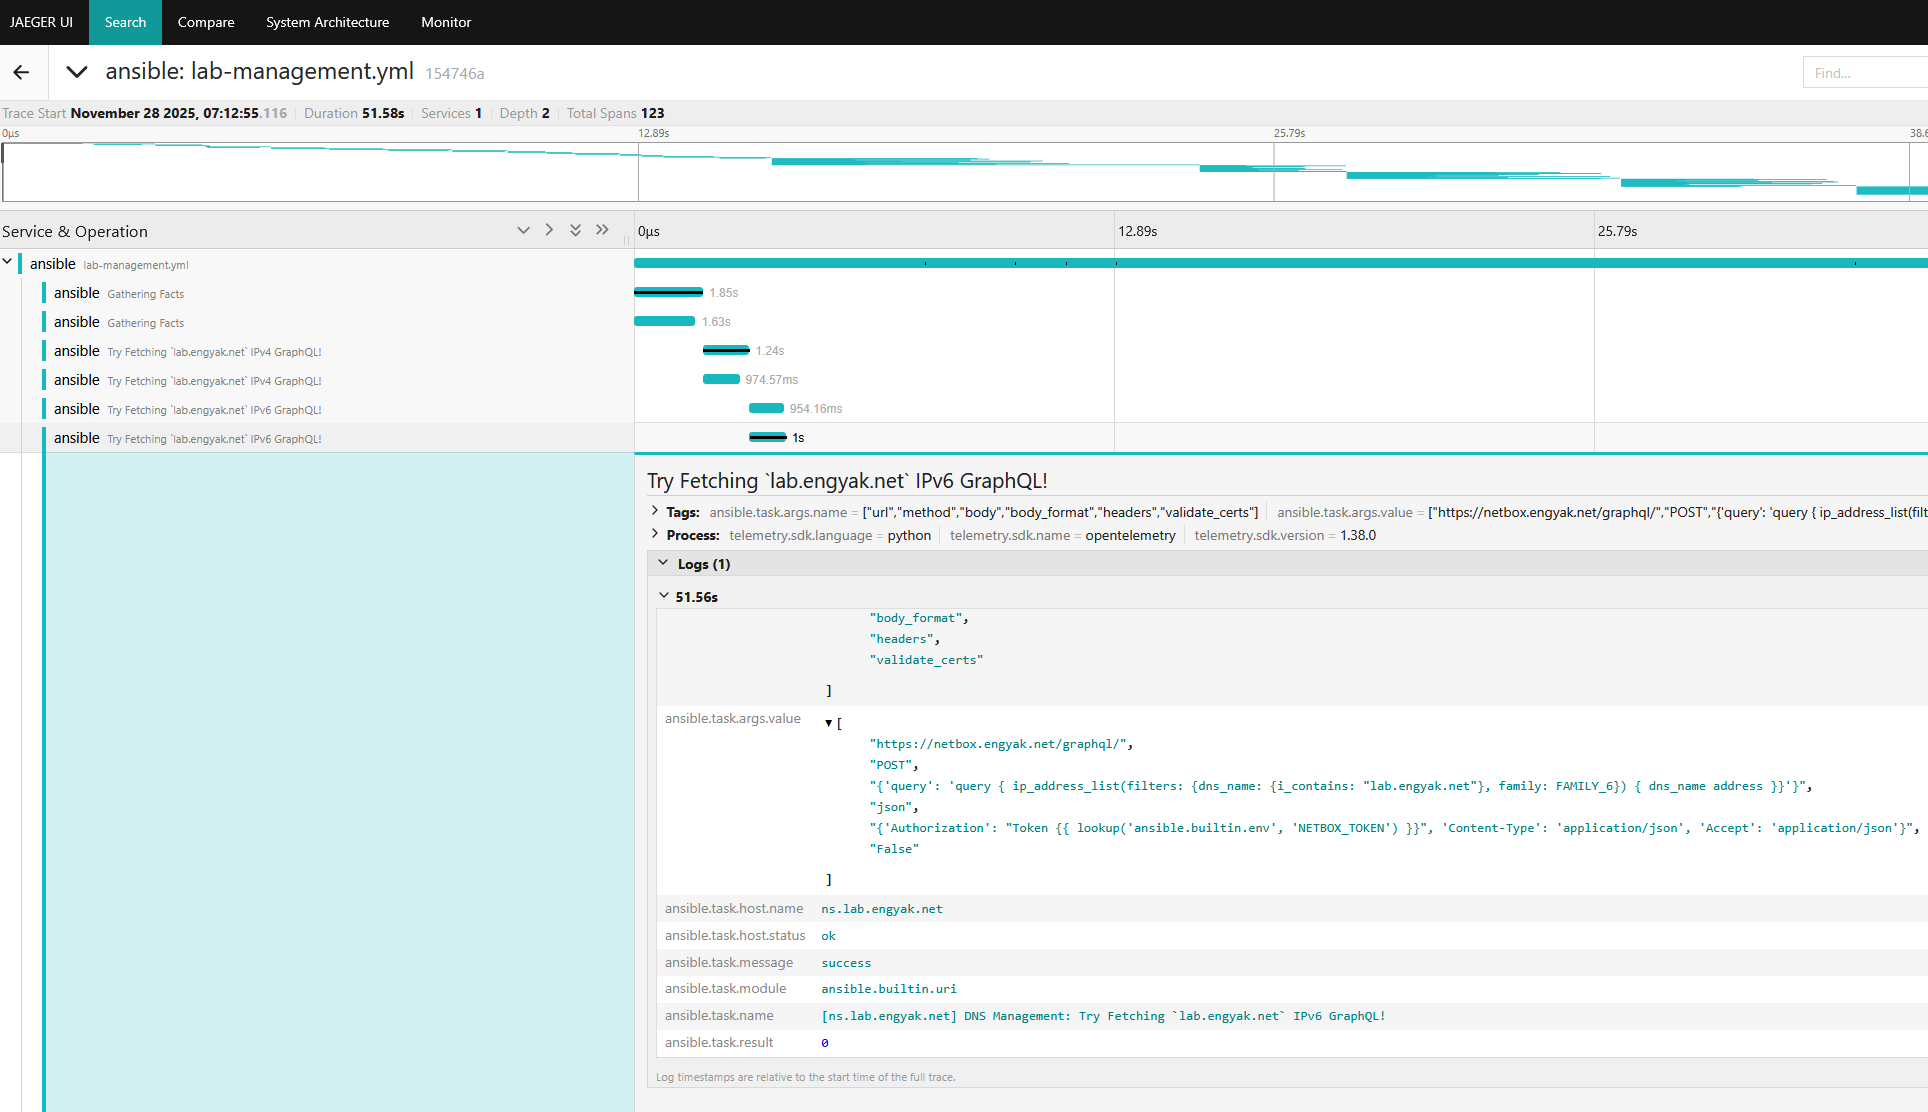
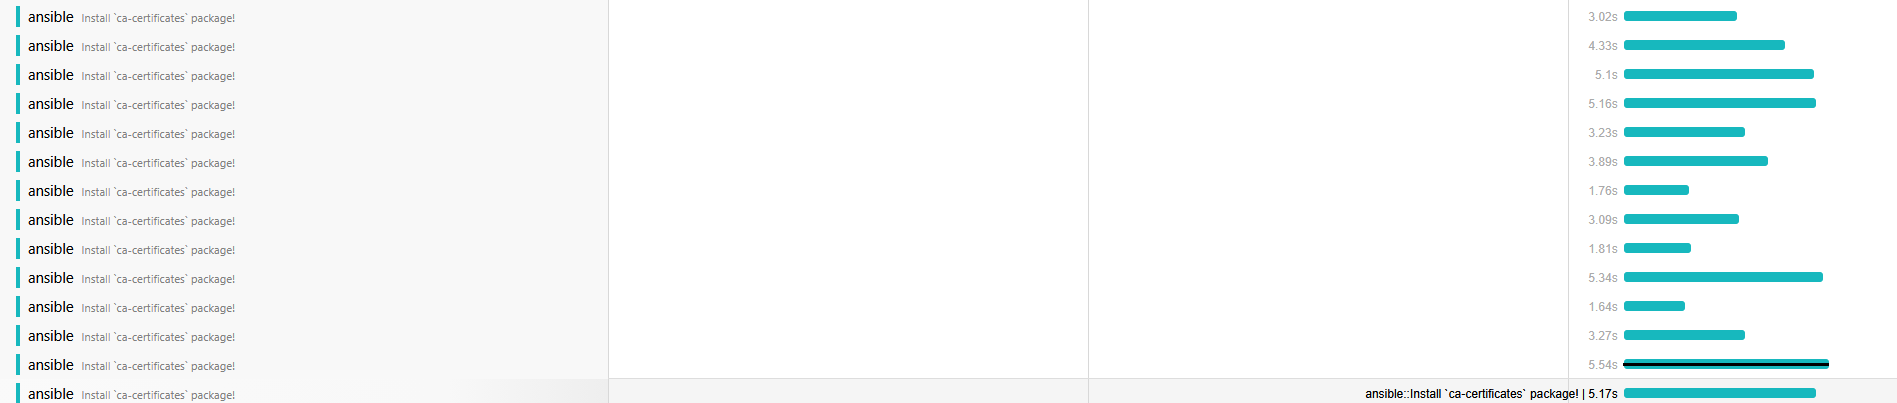
This provides a comprehensive “drill down” for every step taken by Ansible, and I’ve honestly never seen this level of detail before. Every single programmatic step is logged with a timestamp, allowing an engineer to find out:
- Which node took too long
- Which step slowed things down the most
- Whether that matches the baseline for other nodes
For a transactional application this has to be even more useful.
Directing Results to Syslog
Now, for something quite a bit more boring (but equally important). If OpenTelemetry is a microscope, Syslog is the 10,000 foot view. This can also be set up by CI, and should run in parallel with OpenTelemetry:
  env:
    ANSIBLE_CALLBACKS_ENABLED: 'community.general.opentelemetry,community.general.syslog_json'
    ANSIBLE_OPENTELEMETRY_ENABLE_FROM_ENVIRONMENT: 'ANSIBLE_OPENTELEMETRY_ENABLED'
    ANSIBLE_OPENTELEMETRY_ENABLED: 'true'
    OTEL_EXPORTER_OTLP_ENDPOINT: 'http://jaeger.lab.engyak.net:4317'
    OTEL_EXPORTER_INSECURE: 'true'
    OTEL_SERVICE_NAME: 'ansible'
    SYSLOG_PORT: '54514'
    SYSLOG_SERVER: '127.0.0.1'
Each of these callback plugins serves a different purpose. Syslog callbacks provide a shorter summary as JSON, which can easily be dashboarded:
<14>1 2025-11-30T07:41:00-09:00 10.66.1.143 gh-runner2 - - - ansible-command: task execution OK; host: ns.lab.engyak.net; message: {"changed": false, "checksum": "a46e7011b00c560dddcc193ef16f01fd2d05970e", "dest": "/etc/unbound/unbound.conf", "gid": 0, "group": "root", "mode": "0640", "owner": "root", "path": "/etc/unbound/unbound.conf", "size": 4531, "state": "file", "uid": 0}
Some example conditions:
"changed": truewould indicate how many modifications were made per hostname (identified byhost: ns.lab.engyak.net)!= 'task execution OK'would search for job failures
Modernizing the Monitoring Stack
Ansible, despite being an infrastructure tool, provides a good example of the different types of modern monitoring. Thematically, these concepts should be applied to actual applications.
- Traces are an excellent tool to identify software process bottlenecks. Any tool that has long-running jobs can benefit from tracing. They’re computationally costly, so they should be saved for any tool where performance degradation truly matters.
- Syslog is the “swiss army knife” of monitoring. It’s the best tool for simple events, and can be the foundation for event-driven programming.
- Metrics allow infrastructure engineers to “just send the important bits” via tools like
protobuf, sort of like SNMP but better. In the network realm, this is where Model-Driven Telemetry reigns supreme, and in the application stack Prometheus is a popular option.
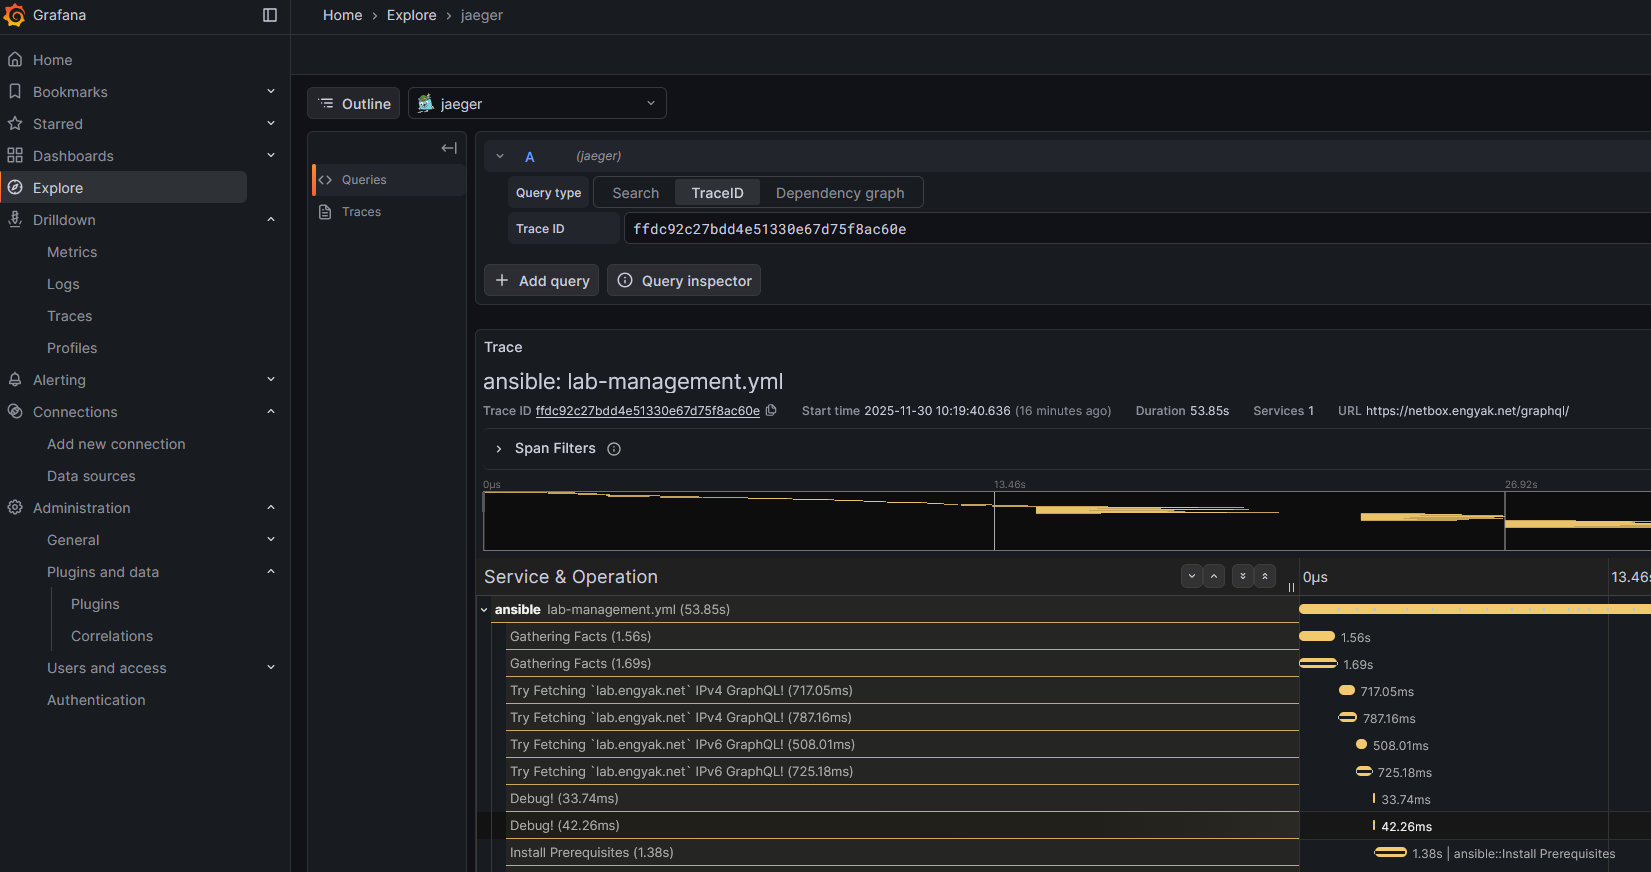
One thing I did find interesting - Grafana + Alloy allowed the unification of all of these data types. Here’s a preview of what Jaeger in Grafana looks like: