
Grafana PLAG Starter Kit
Modern, but complex and highly customizable
The IT industry hasn’t deviated too much from the “fundamentals” of basic Network Monitoring Systems (NMS); software projects like Cacti and Librenms have been a staple for organizations that want to get good infrastructure visibility for decades.
The “default option” for NMS excels at providing basics (CPU, Memory/Disk monitoring, Interface statistics) but it struggles in a few areas:
- Correlating events
- End-to-end testing of performance (e.g. synthetic testing)
- Custom metric tracking via API (doable, but it takes some code)
To solve this problem for my home lab, I’ve set a few objectives:
- All application configuration must be done by a CI/CD template, from code
- All applications must be modular and scalable
- All monitoring data must be visible from one front-end
How it Works
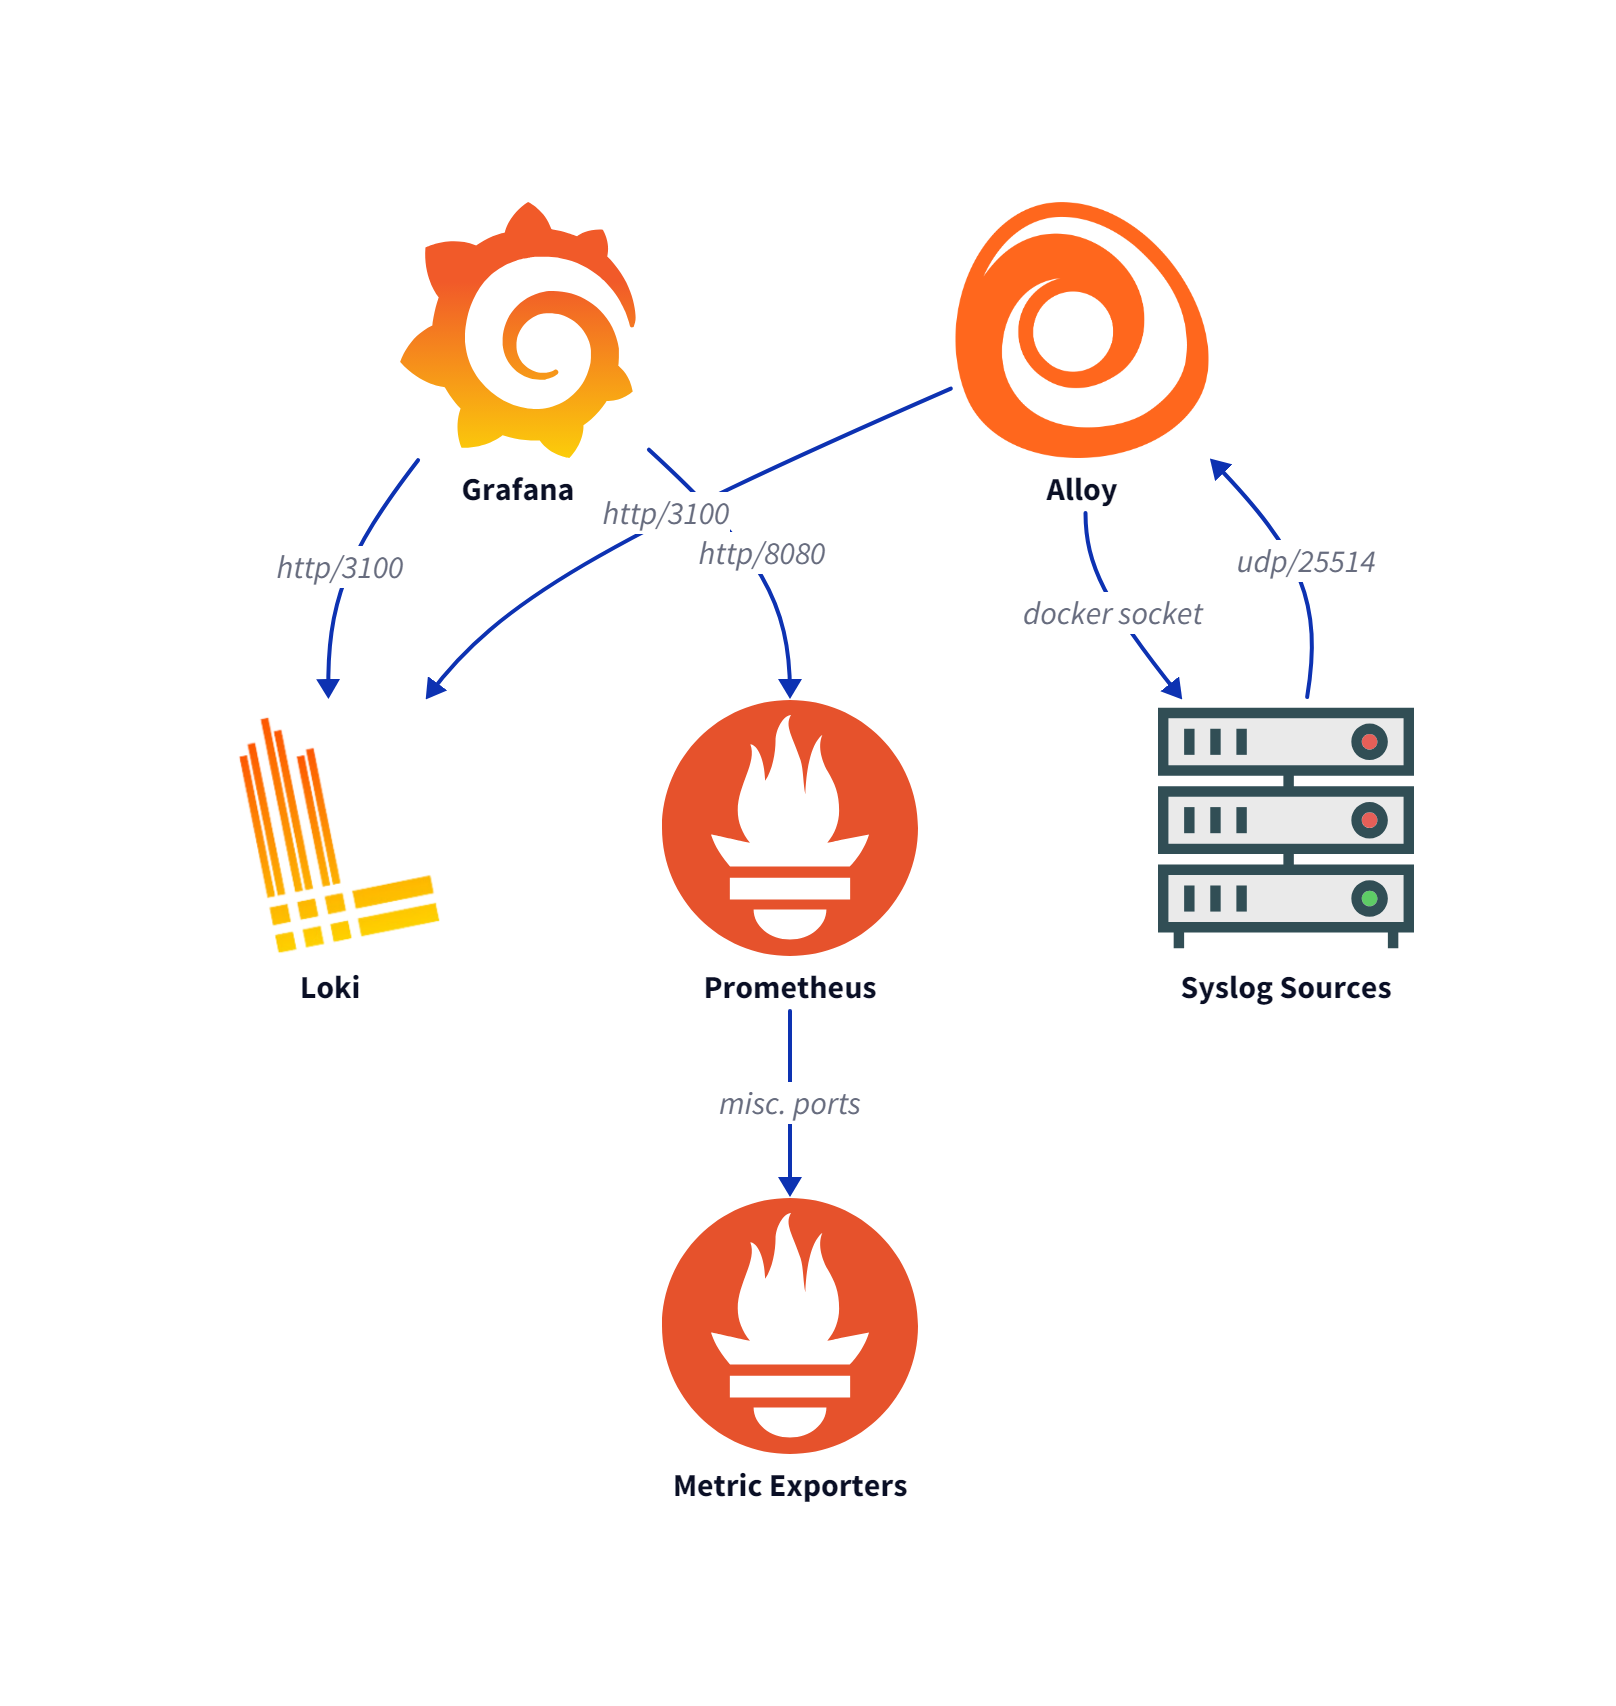
- Grafana works as a presentation layer / front end; it doesn’t store the presented data
- Loki stores log data, and it’s picky. It receives log data from Alloy and presents it over an HTTP API
- Prometheus ingests and stores metrics, time series data like memory %, CPU and presents it over an HTTP API
- Exporters (Gatus in this example) expose their metrics to Prometheus in a standard HTTP API format (
/metrics)
Grafana’s ecosystem may feel a little messy, but it’s just how microservices are designed to function. Each service focuses on delivering a specific function instead of trying to do it all.
The IaC (Ansible playbooks, Jinja templates, Docker compose files) here build this out:
- Grafana (systemd unit)
- Prometheus (systemd unit)
prometheus-node-exporter- on Hypervisors and the Grafana VM- Alloy (container), Scraping the local journal, docker logs, and a syslog forwarder
- Loki (container), receives data from Alloy
- Gatus, tests service reachability and generates Prometheus metrics
Deployment
To build this, I created a new host inventory tag in Netbox, and used the linked inventory. Here is the code:
The Ansible playbook delivers all configurations, adds relevant repositories and installs packages all in one shot.
This took a lot of trial and error to build, and it thoroughly validated my choices to manage the deployment with CI/CD. Here are some of the gotchas I ran into along the way:
- Docker forwards TCP only by default when you specify a port in compose, so syslog needs
/udpappended to it - Prometheus’ systemd service didn’t easily let me set a custom listening address, so I customized the systemd unit
- Uptime-Kuma may be popular for localized monitoring, but it does not support programmatic configuration. Gatus does, and it quickly became my alternative
- Alloy can scrape all kinds of useful logs that would otherwise be hard to get!
- Loki and Prometheus rotate storage by default, so if they’re assigned a persistent storage volume the application itself will keep things nice and tidy. Retention policies are well-supported.
After Deployment, it’s still complicated
Here’s where I think most people get stuck with Grafana - there is a dizzying array of different, all highly valuable metrics and none of the monitoring is “canned”; all dashboarding/alerting/presentation must by assembled manually.
Here are the most useful metrics from what I’ve seen so far:
- Gatus Exporter
gatus_results_certificate_expiration_seconds: This can be translated by Grafana into a more meaningful interval, e.g.weeksgatus_results_duration_seconds: Transaction time for a monitored asset. “Latency”
- Node Exporter
node_filesystem_free_bytes: Proactively detect when the disk is fullnode_filesystem_readonly: FSRO is a very real issue in shared infrastructure, and detecting it is usually symptom-based (once something’s failed)node_memory_MemAvailable_bytes: This metric helps disambiguate filesystem caching for those unfamiliar with Linux - this eliminates users’ need to understand that and one simple metric can be tracked insteadnode_nf_conntrack_entries: Open connections (UDP/TCP for the system)node_os_info: Not really useful for monitoring, but it’s possible to report on a fleet’s OS inventory this waynode_reboot_required: Updates will trigger this flag, if a patching workflow doesn’t automatically include a reboot step this is a useful thing to tracknode_time_clocksource_current_info: Detect when NTP stops doing what it should
Security
All of this network traffic is cleartext, which with some exporters (json_exporter in particular) is a problem, because it will be sending or storing credentials in cleartext.
If confidentiality is not a concern, a way to enforce some level of hardening would be to implement a firewall (ufw, AWS Security Groups, Azure Network Security Groups) only allowing Prometheus access to the Alloy or exporter agents. This is very simple and should be considered the minimum.
If confidentiality is a concern, each component will need to implement TLS, and it’s done differently:
-
Docker and systemd both have a weakness when it comes to storing key material in the filesystem - it has to be retrieved from somewhere. I’d recommend exploring Hashicorp Vault or any other CI alternatives for just-in-time storage of key material
Takeaways
PLAG (Prometheus, Loki, Alloy, Grafana) is an excellent stack to build extensible and comprehensive monitoring for a platform, but it doesn’t make it easy. Commercial products excel at “easy button” deployments where you don’t really need to comprehensively learn your environment to monitor it effectively, and none of that is provided here.
If the Grafana ecosystem is on your shortlist, I’d recommend having an honest conversation about how much time is available to invest in monitoring; Grafana is high-effort and high-reward. All of this data is worth it, but it will take some work to get things usable.